Cutting compute costs by 30% by redesigning AI responses around common tasks
- AI Product design
- Role: lead product designer
- Team: product manager, data scientist, 2 engineers, policy consultant
PolicyCopilot is a tool used by policy-makers to diagnose policy problems. The tool included an AI chat that helped users retrieve evidence from a curated knowledge base.
Summary
- Context
- A new partnership would bring 100+ users we couldn't afford to support at current compute costs
- Approach
- Users were expensive because answers didn't fit their task, so they kept asking follow-ups
- Outcome
- Compute cost per task fell 30%, and we supported the partnership within budget
A partnership bringing 100+ new users would have pushed compute costs over budget
I worked with our engineering team to lower costs without making the product worse
Making each answer less detailed was cheaper but would have backfired because
thinner answers drive more follow-ups
If answers got thinner, we'd lose the savings in volume while degrading the experience. Before cutting anything, I wanted to understand why users sent so many messages.
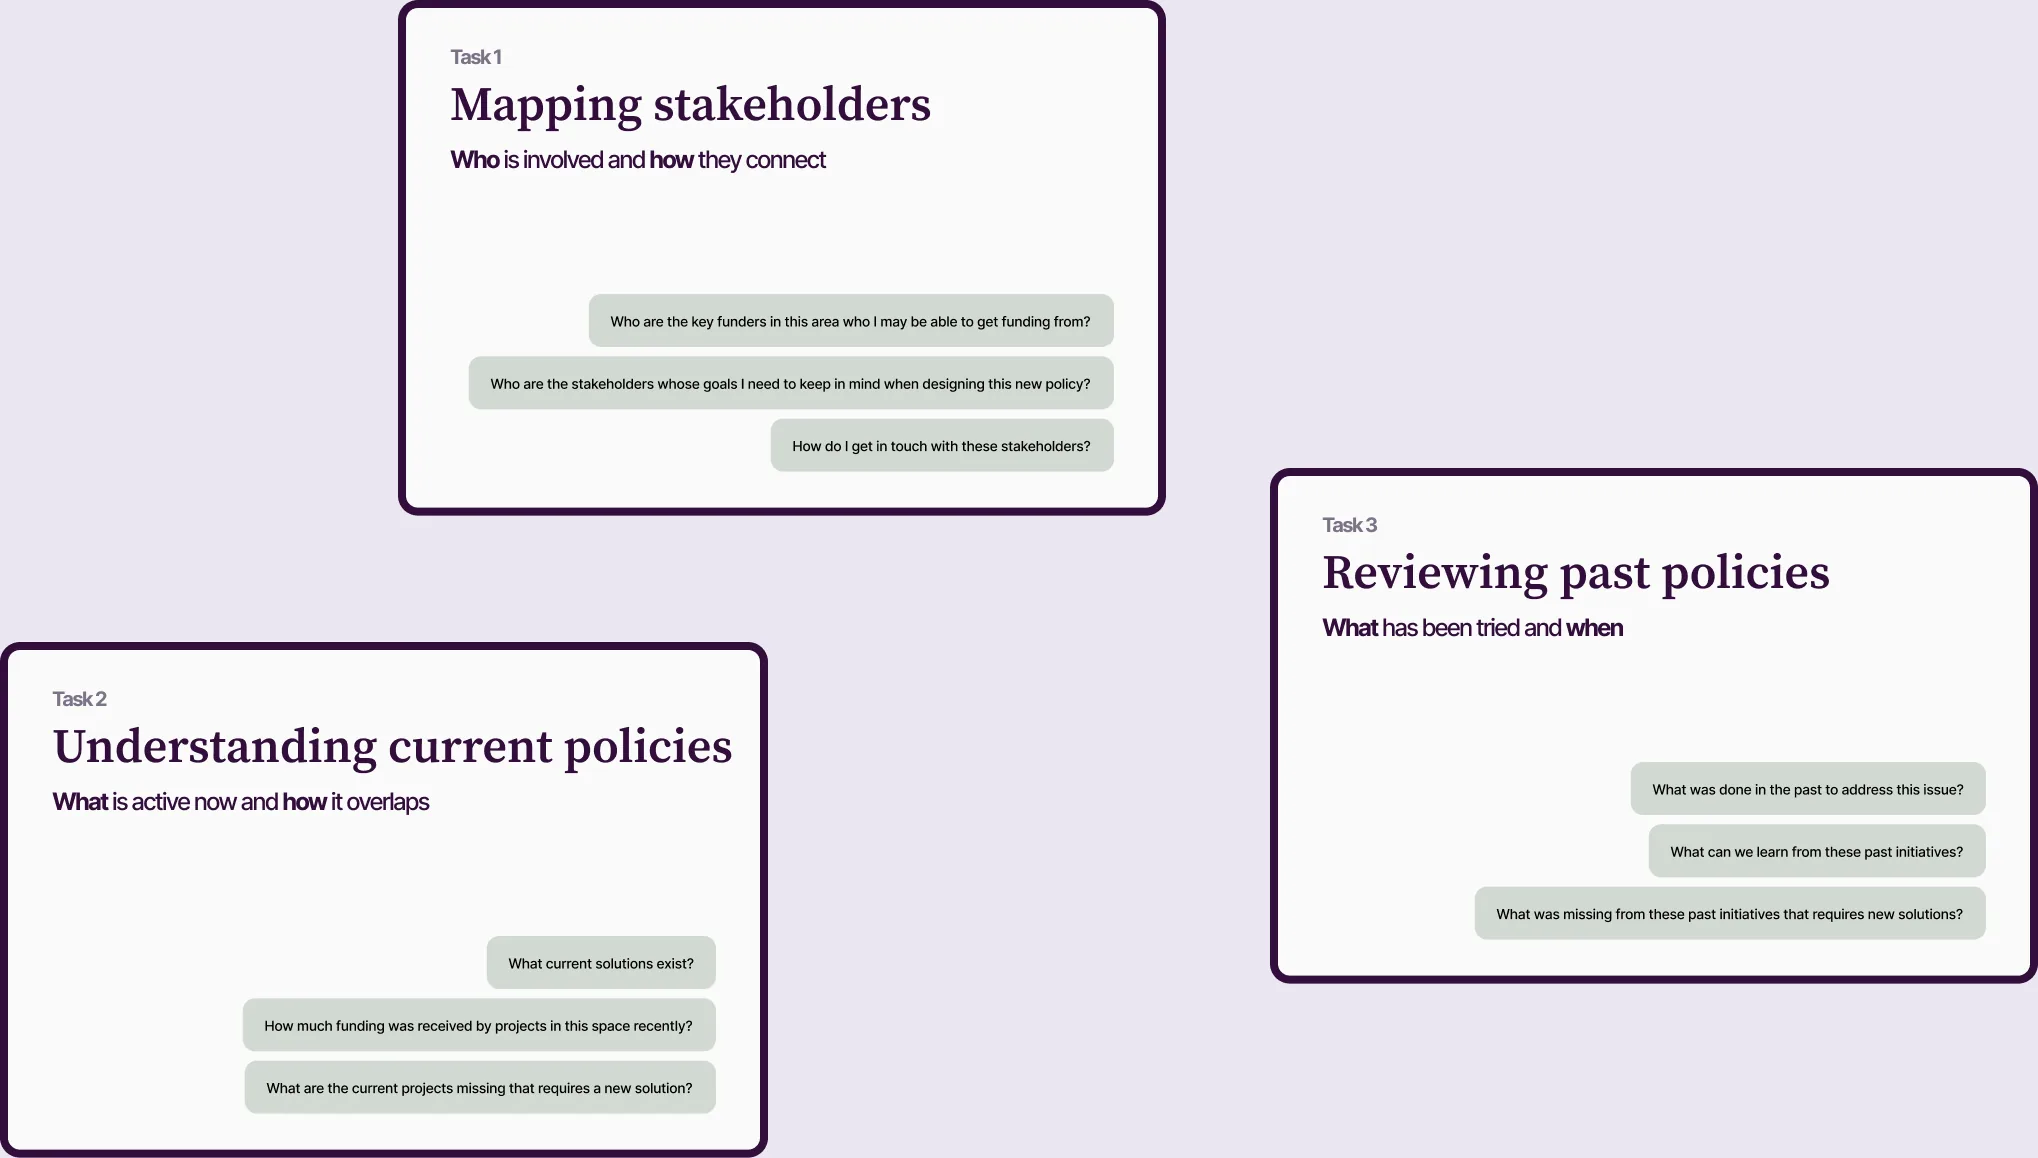
2/3 of messages came from 3 tasks where users had to piece text answers together themselves
With our data scientist, I analyzed 90 chat sessions and tagged each by what the user was trying to accomplish.
In 12 user interviews I led, users described asking follow-ups to retrieve dates, reformat lists, or find which policies overlapped
The answers had the information but not the shape they needed
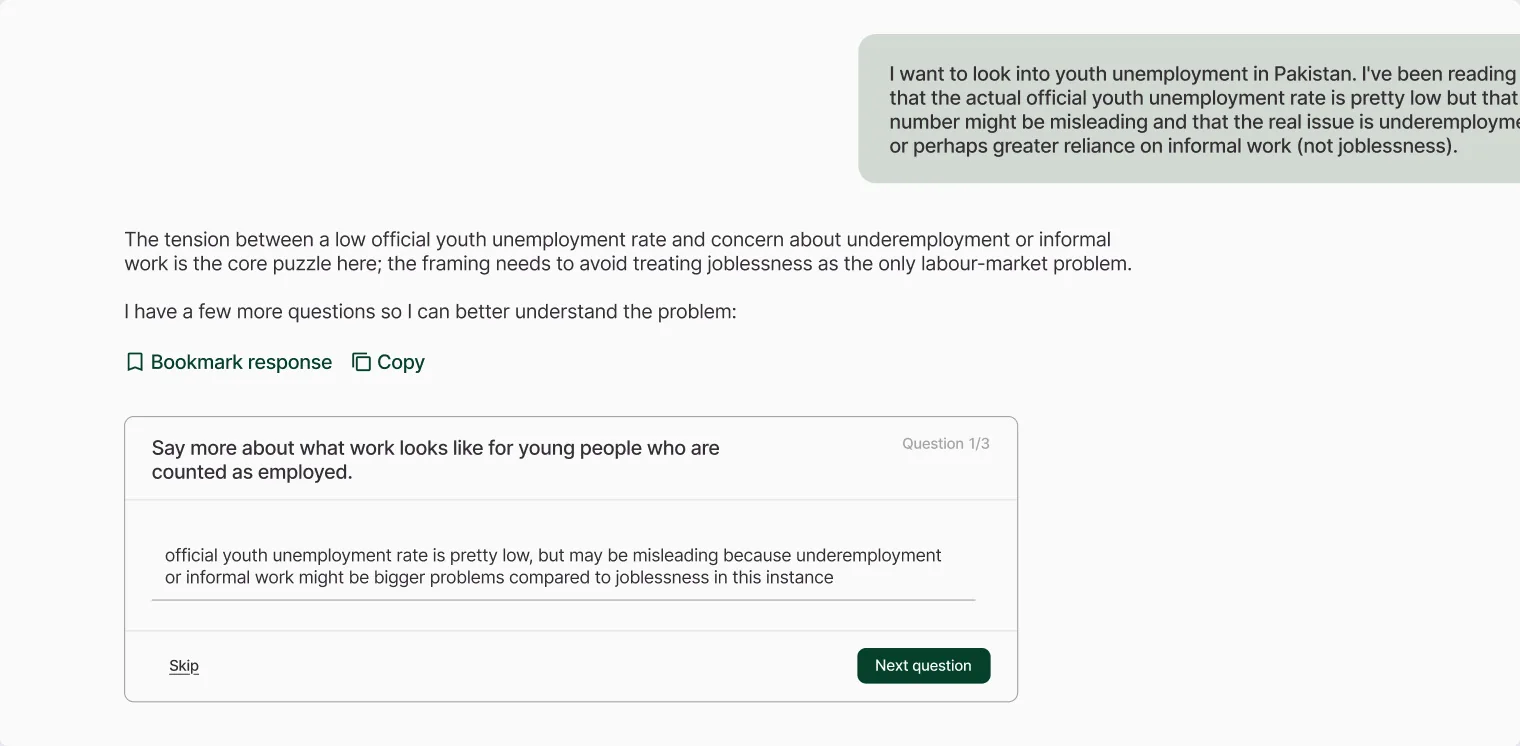
Sample: Getting the data to the correct “shape” took 4 turns
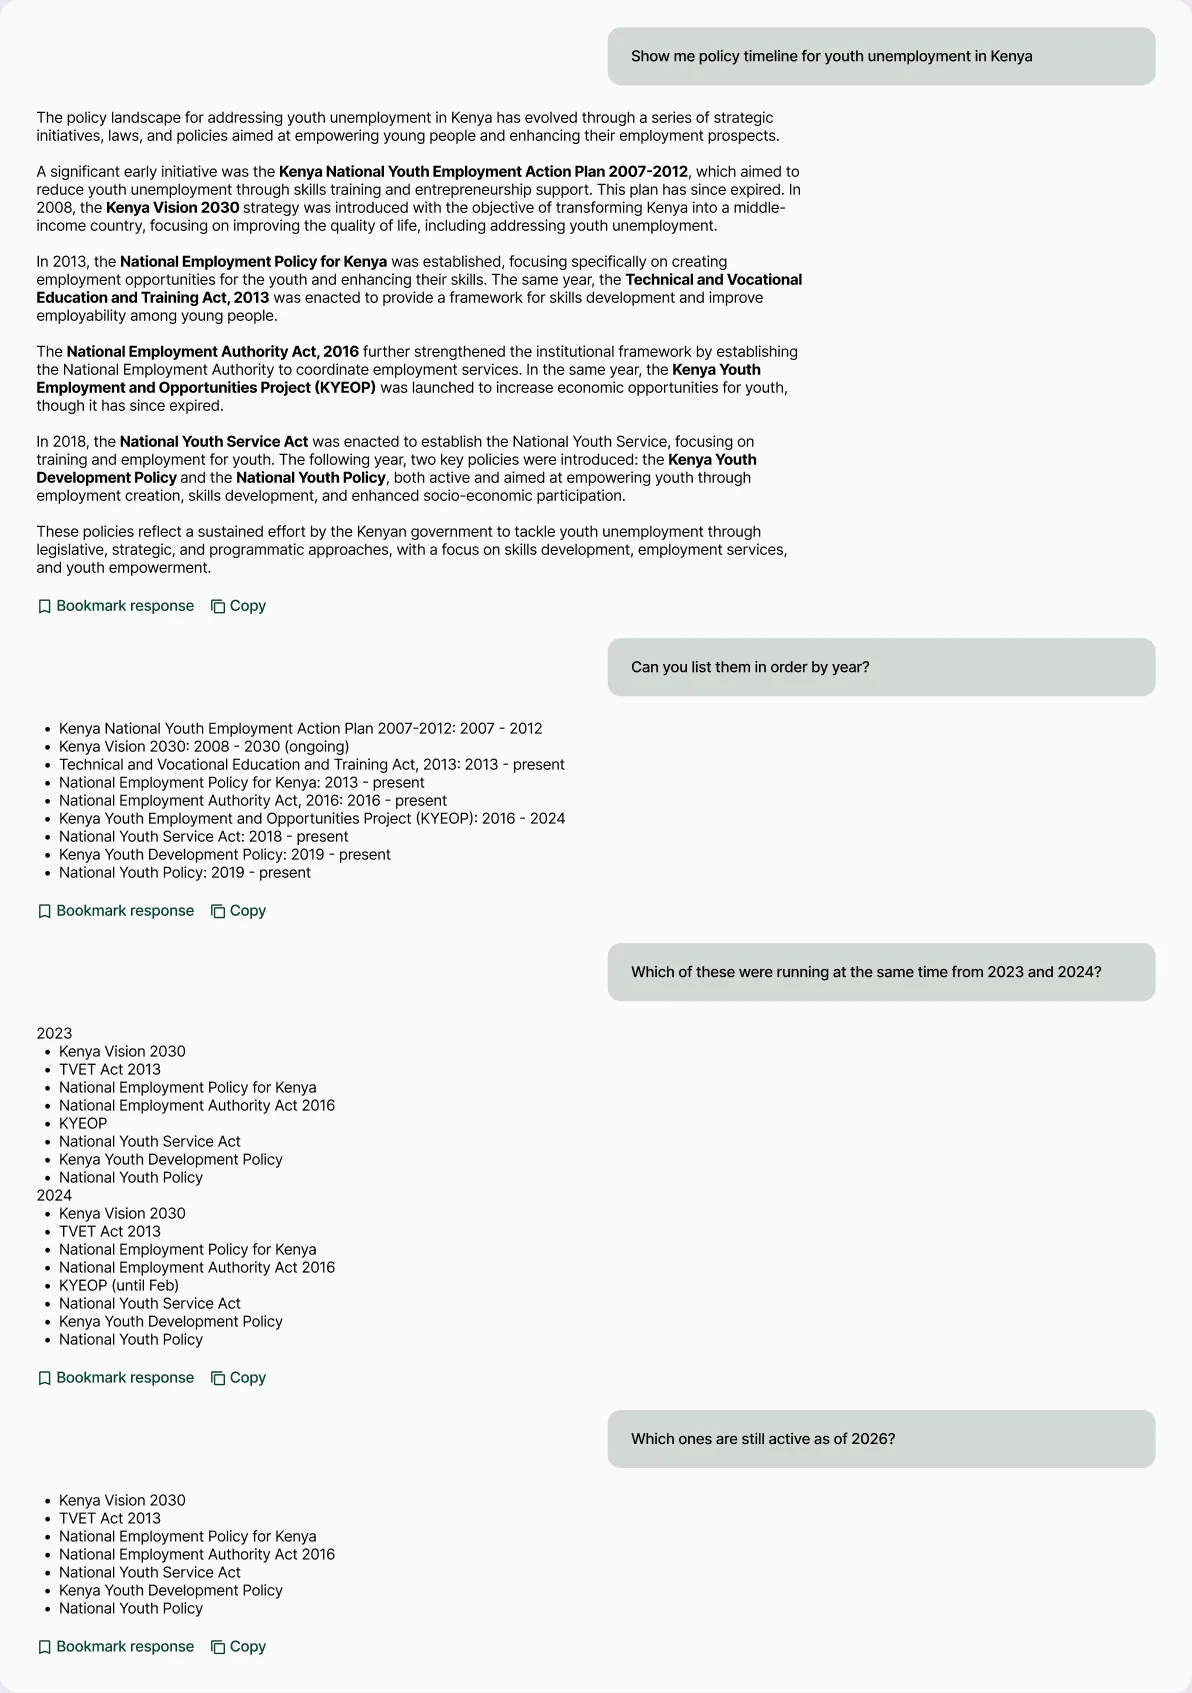
Visual answers cost more per message but less per task because one visual replaced on average 2-4 follow-ups
Measured per message, visual answers looked like the wrong direction. Measured per completed task, they were cheaper.
Users also told us visuals were easier to skim and made patterns visible faster. Some said visuals were a reason to choose PolicyCopilot over a general-purpose AI tool.
Showing high-value visuals by default and offering costly ones on request kept spending in check
With an engineer, I plotted each candidate content type by user value and expected compute cost:
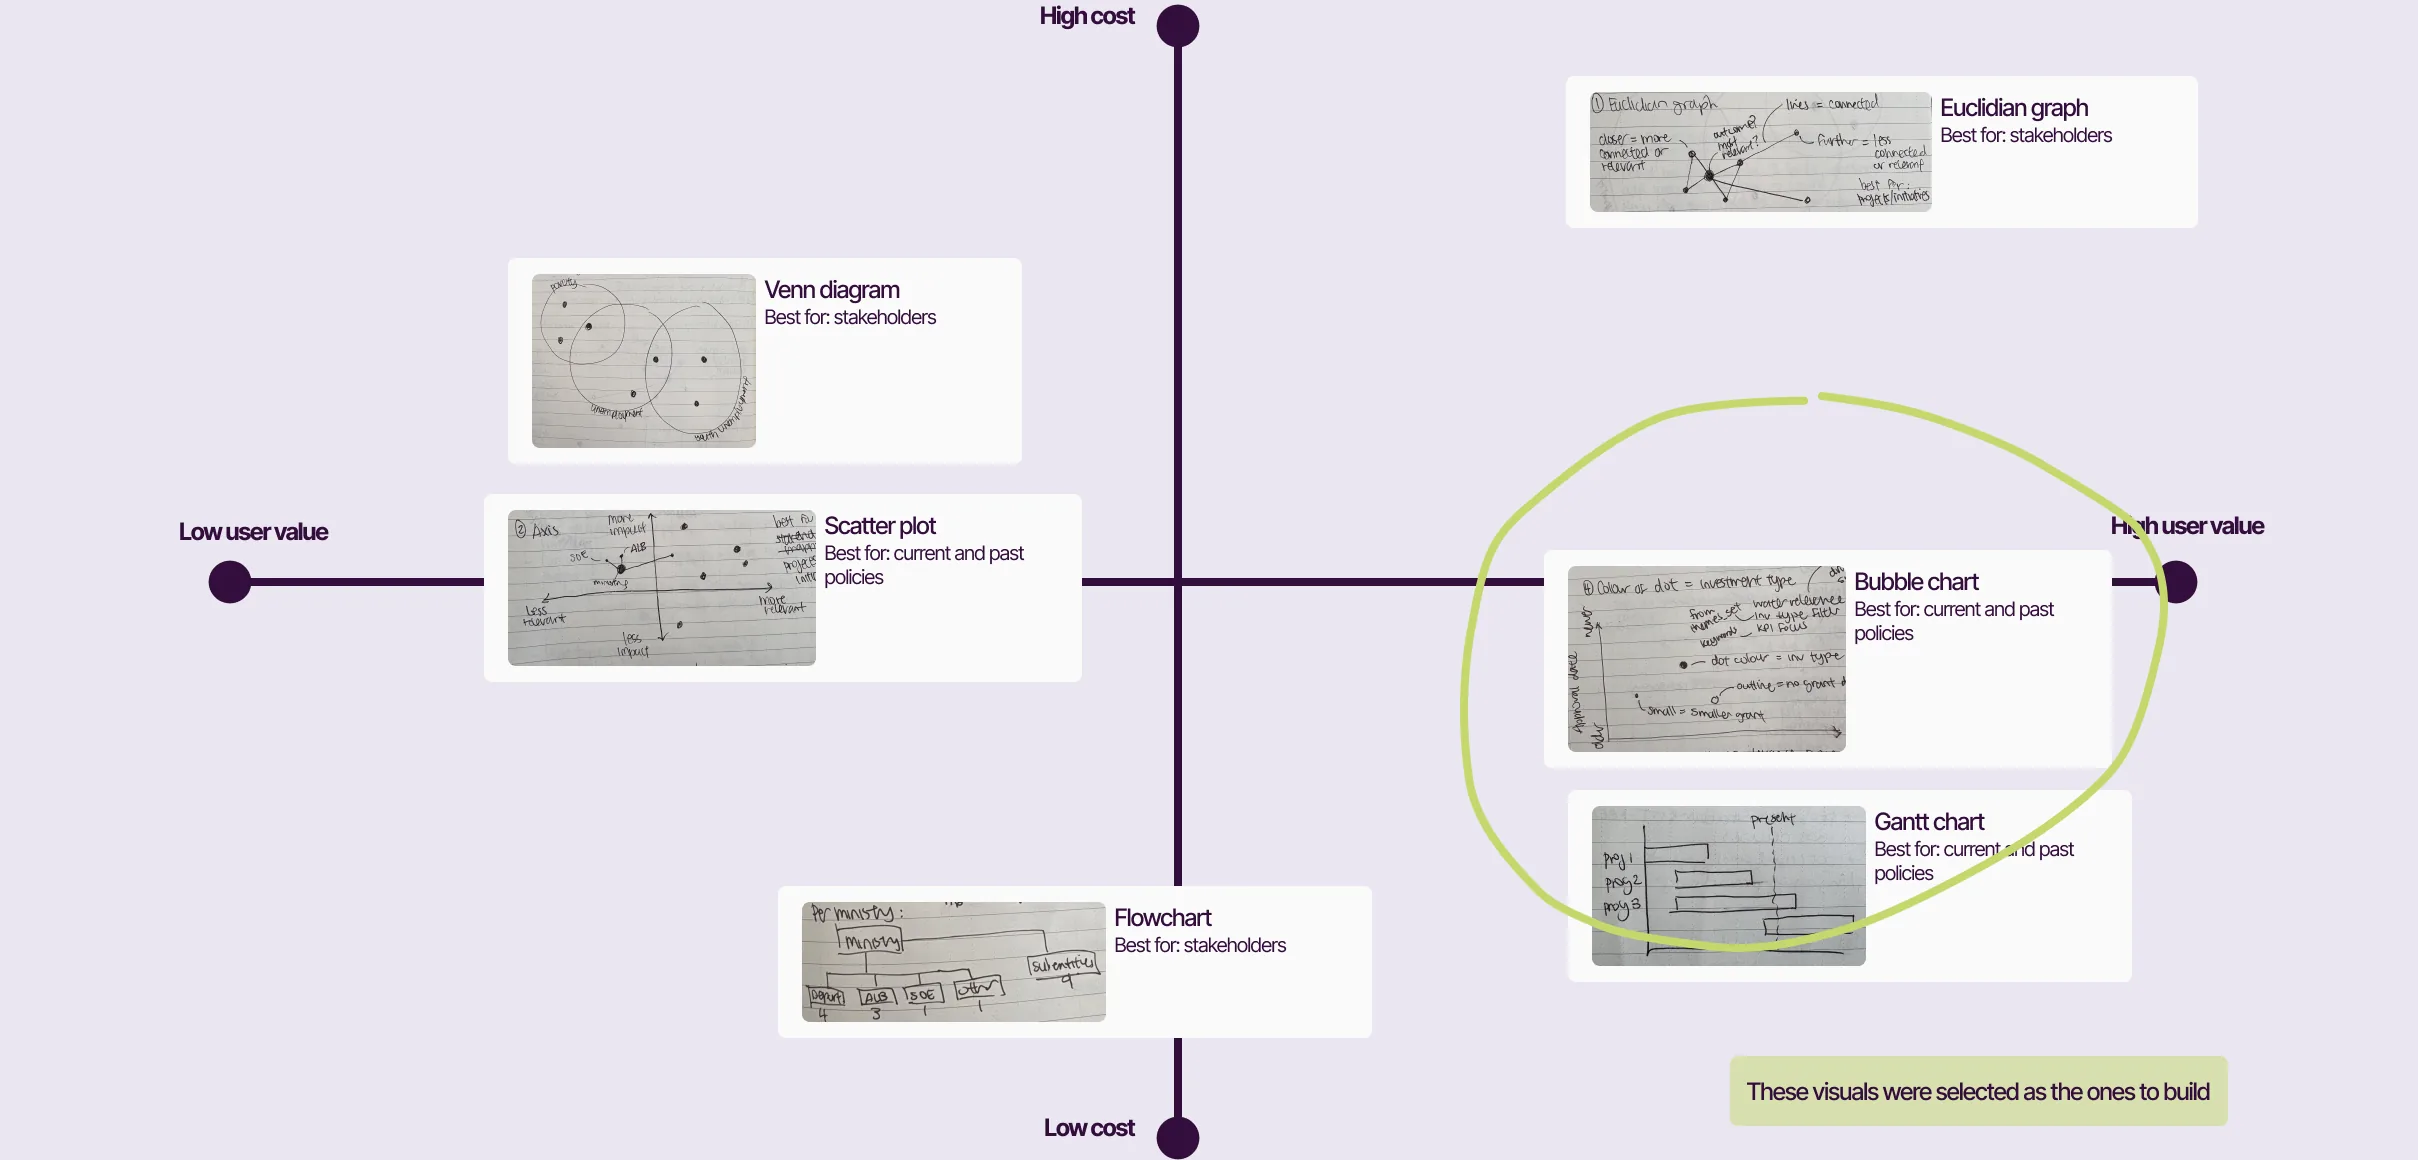
Each visual answered questions users previously needed several follow-ups to answer
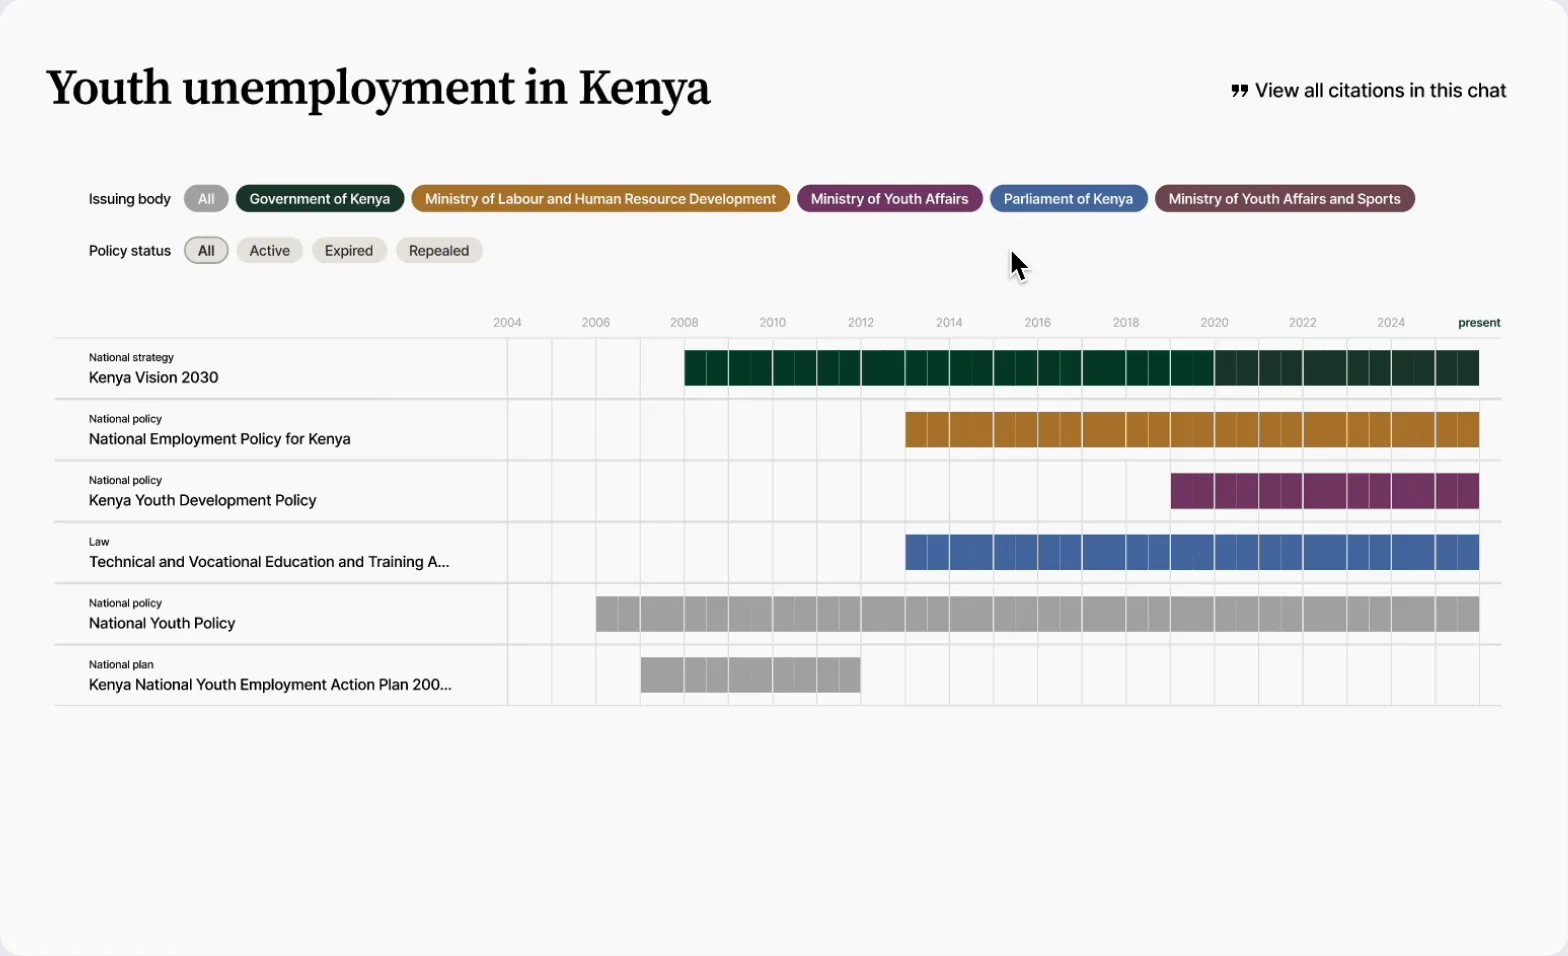
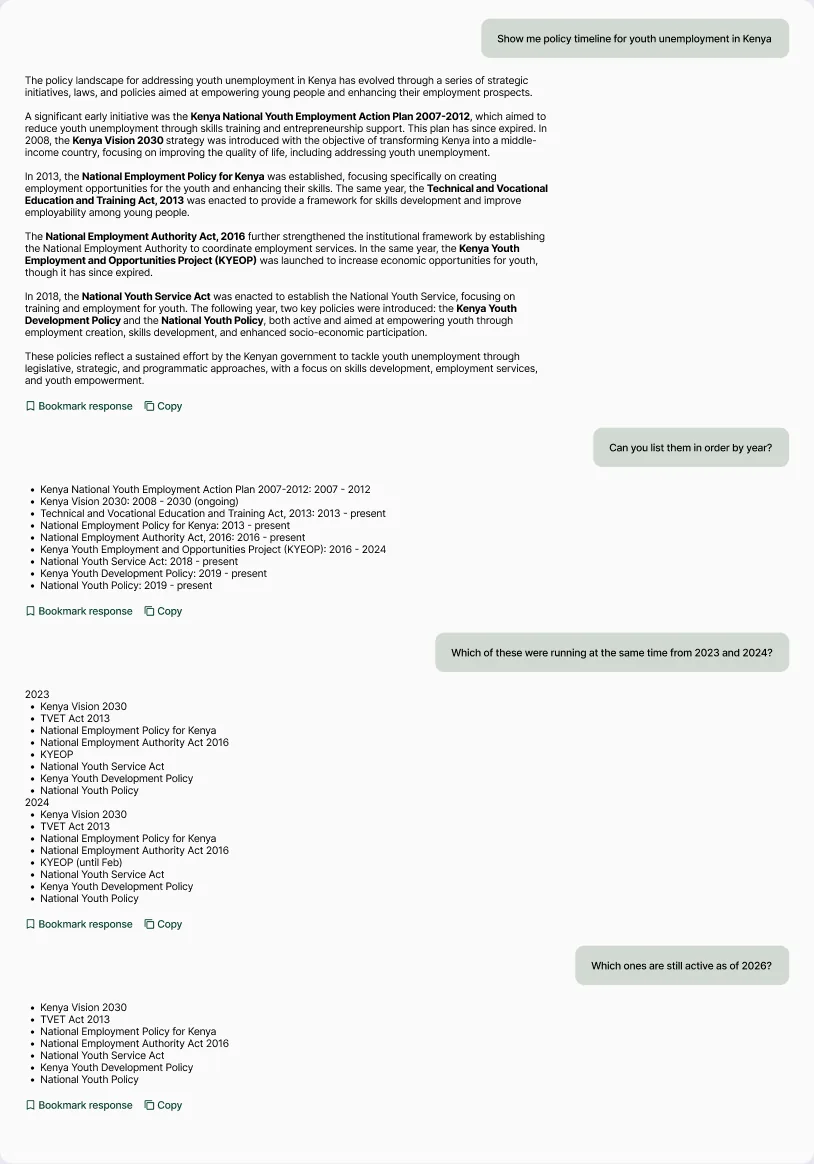
“Show me policy timeline for youth unemployment in Kenya”
Before
Text lists forced users to rebuild the timeline in their heads
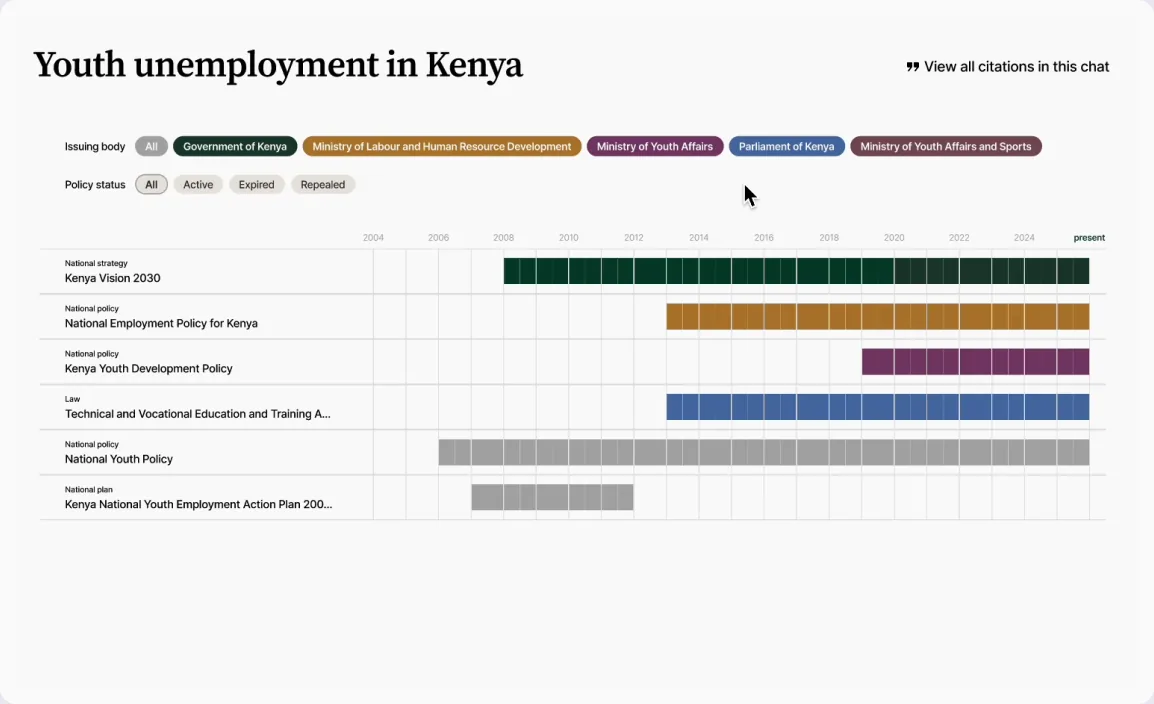
After
The Gantt chart makes order and overlap visible immediately
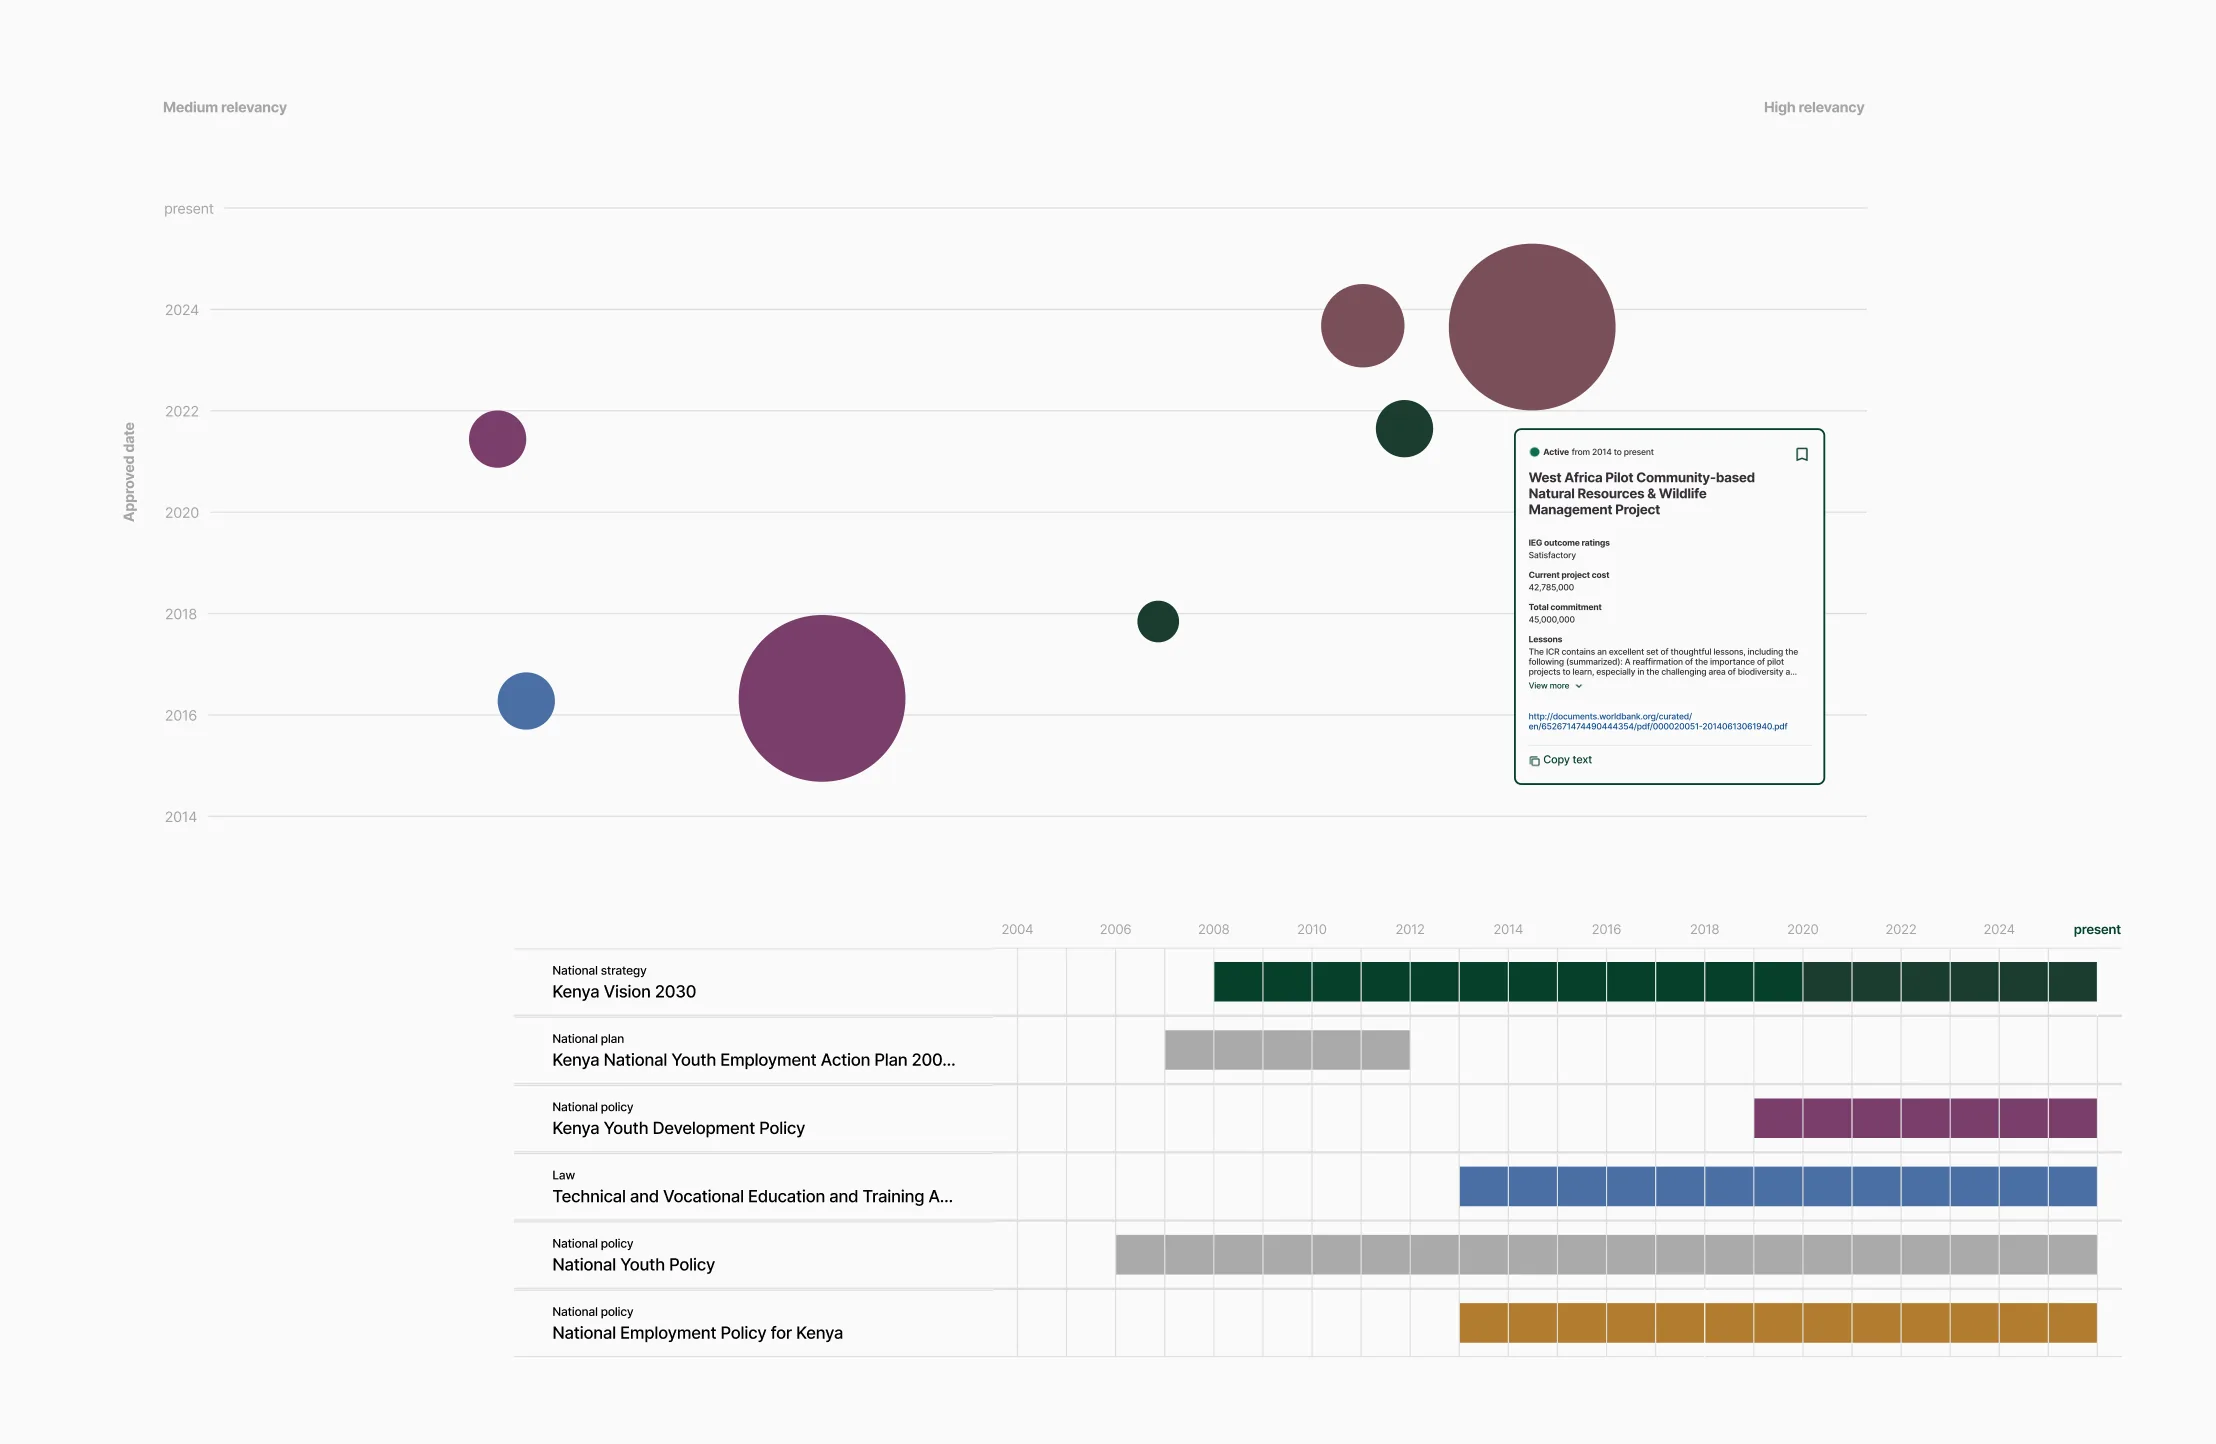
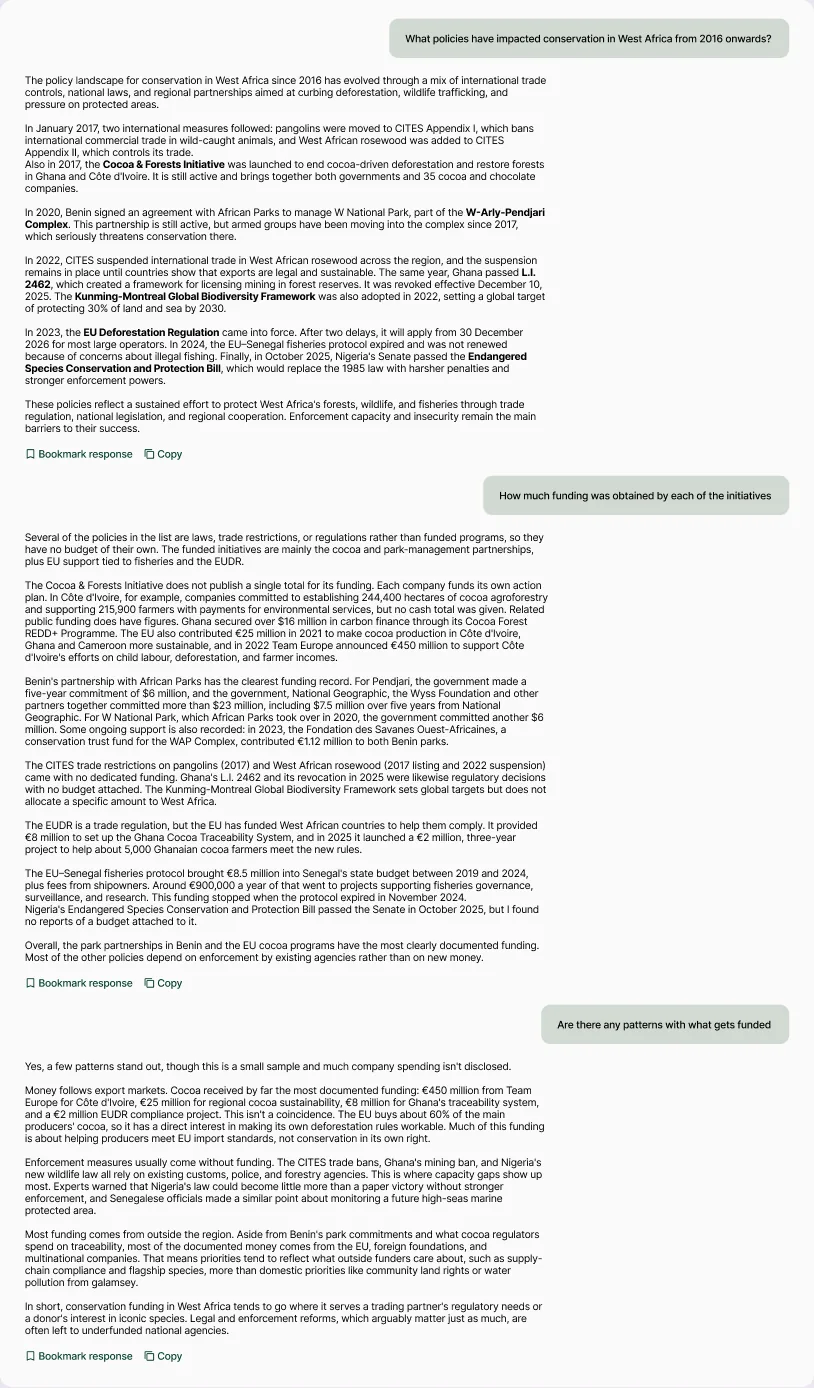
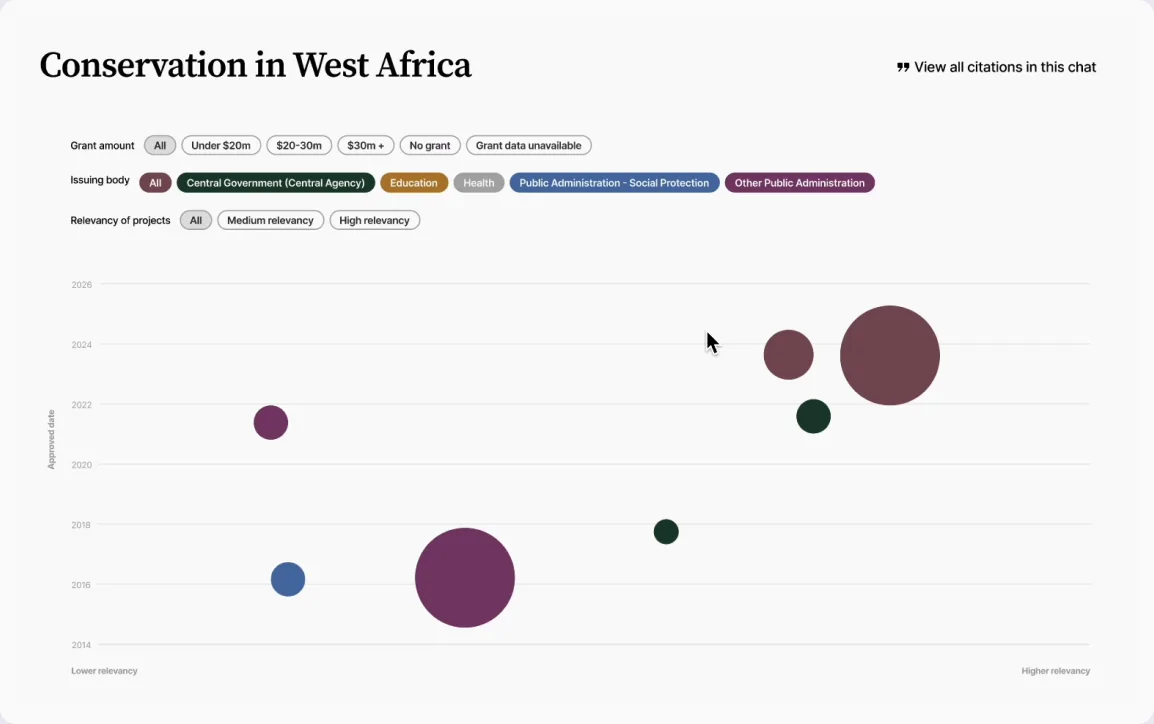
“What policies have impacted conservation in West Africa from 2016 onwards?”
Before
Text responses did not reveal patterns and required a new followup question to obtain new information
After
Sizing bubbles by funding received showed which projects attract funders without users comparing figures
Cost per task dropped 30% while task completion held steady, so we could onboard all 100+ partnership users
Stats
- -30%change in compute cost per task
- 6 → 2average messages per task
- +45%cost per message
(accepted trade-off)
The cheapest AI answer is the one that finishes the task in the fewest turns
If I did this again, I'd measure task success from the beginning rather than relying on message count, since fewer messages can also mean users gave up. Next, I'd explore extending the approach to other task types.